Find out more about our academic programs
Find out more about our academic programs
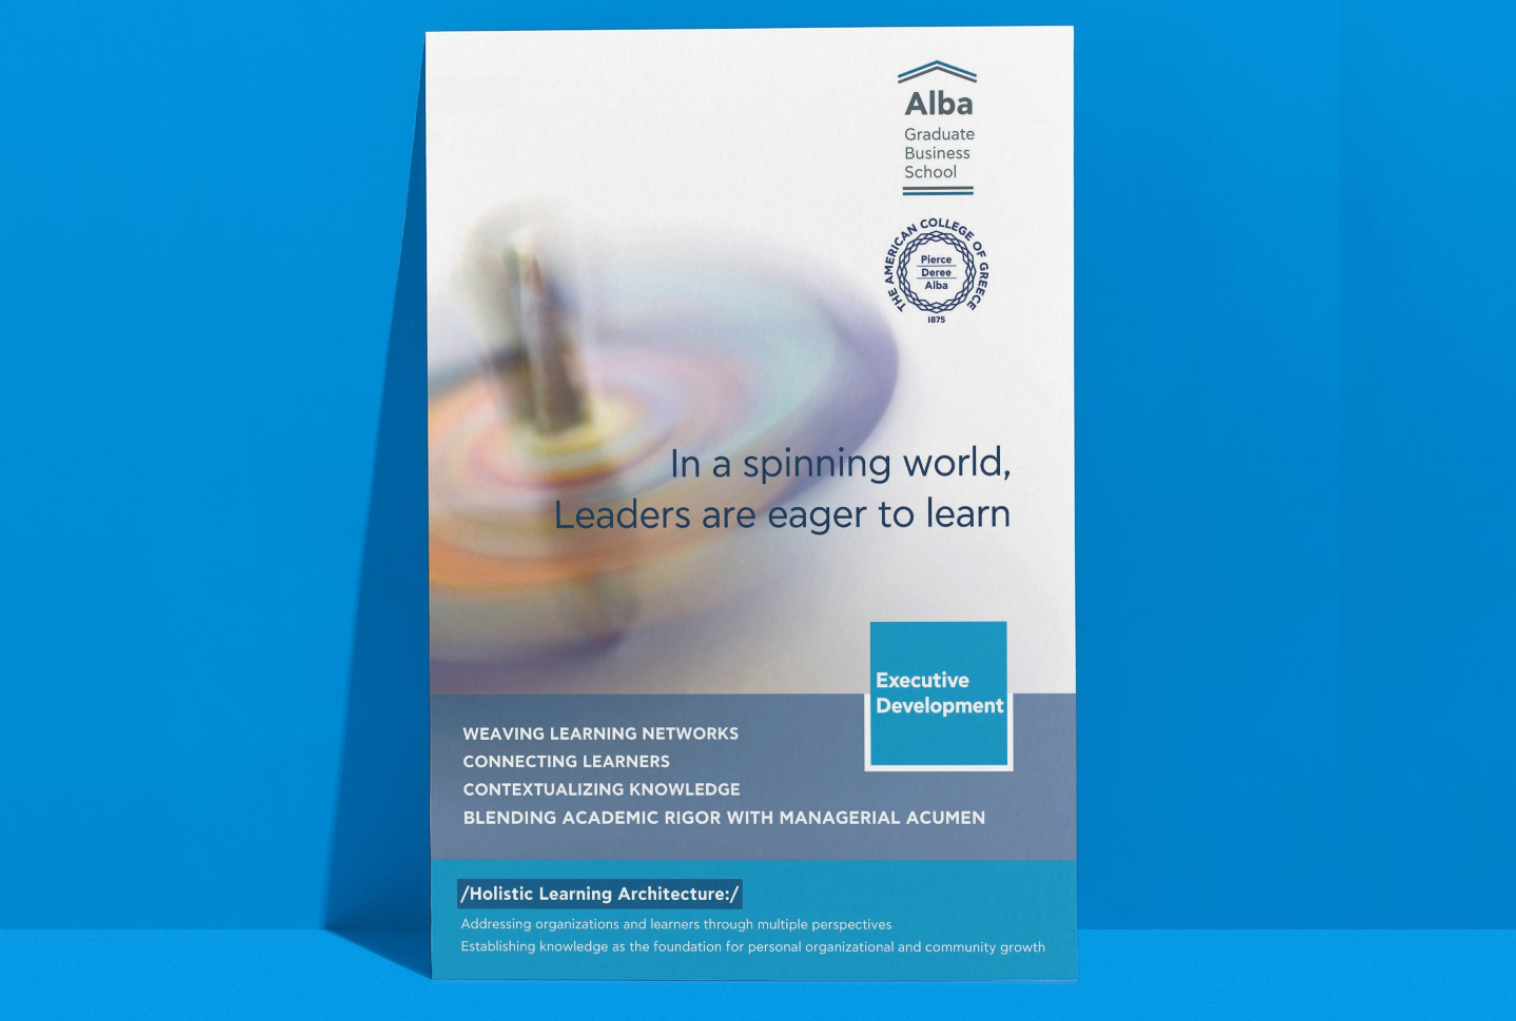
In a spinning world Leaders are eager to learn

Find out more about our career services

RCI
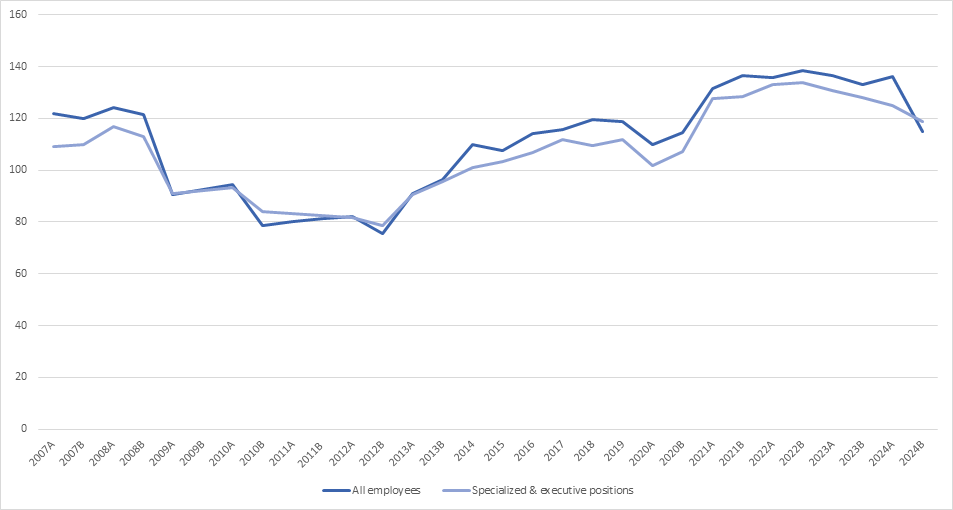
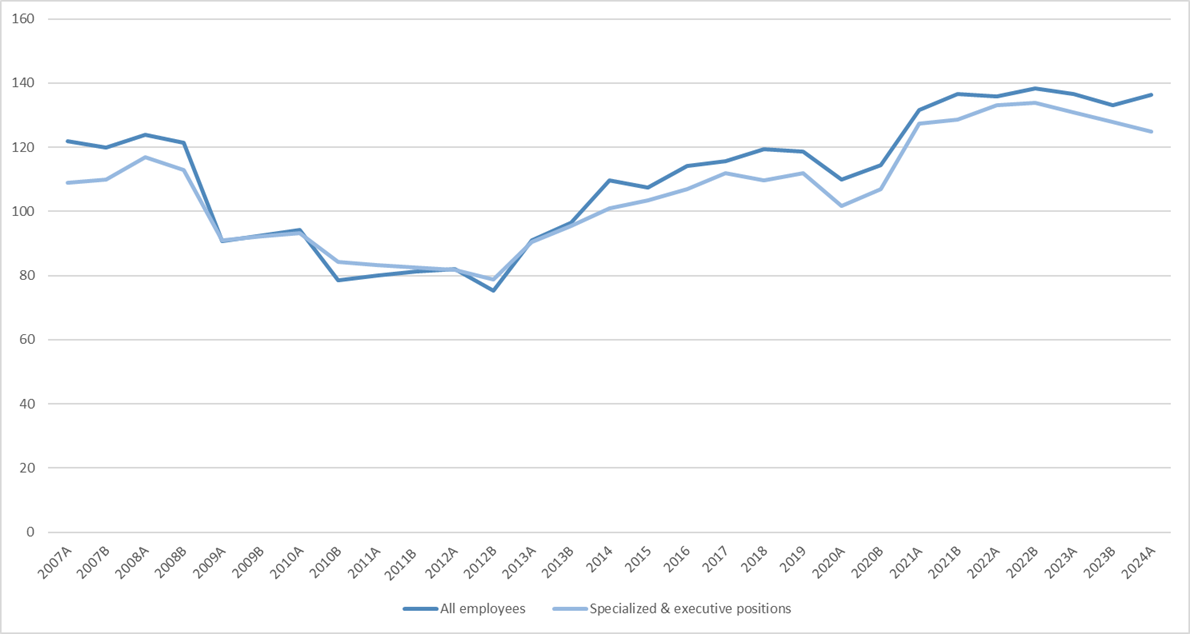
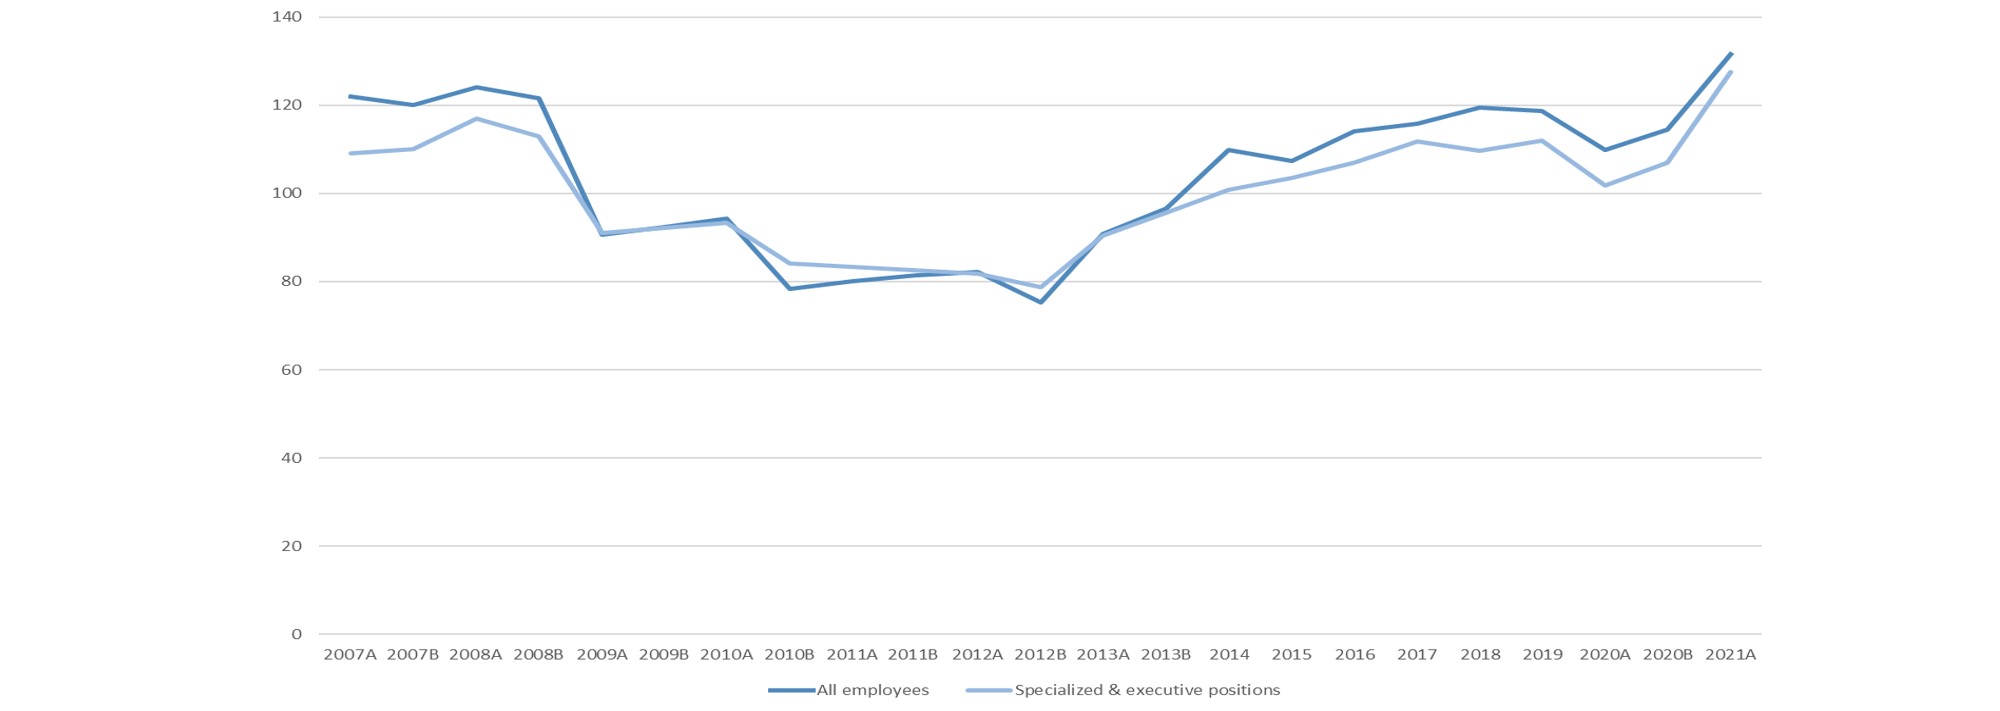
The RCI index measures anticipated changes in the activities of attracting and selecting personnel.
Values higher than 100 indicate an expected rise of such activities, while values lower than 100 indicate an expected drop of these activities. Values close to 100 mean that expected activities of this type will remain at the same level.
The Barometer of Labour Market in Greece: Recruitment Confidence Index (RCI).
This research study is organised by the Applied Research and Innovation Department of Alba Graduate Business School, American College of Greece. The study is carried out on an annual basis every March to May, with the purpose of monitoring the trends in the activities of attracting and selecting personnel as well as detecting the labor market expectations for the following months in Greece. RCI was conducted for the first time in Greece by Alba Graduate Business School in 2007. It was initiated in the UK in 1999 by Cranfield School of Management and The Daily Telegraph and was later introduced in Spain (2005), Portugal (2008) and Ukraine (2011).
All Surveys
2024-B
The Index
For the second semester of 2024, the general Recruitment Confidence Index decreased from 136.3 (in the 1st semester of 2024) to 114.8 and the specialized Index for managerial and executive positions also dropped from 125.0 (in the 1st semester of 2024) to 118.8.
Sponsors

Special Theme Supporter

2024-A
The Index
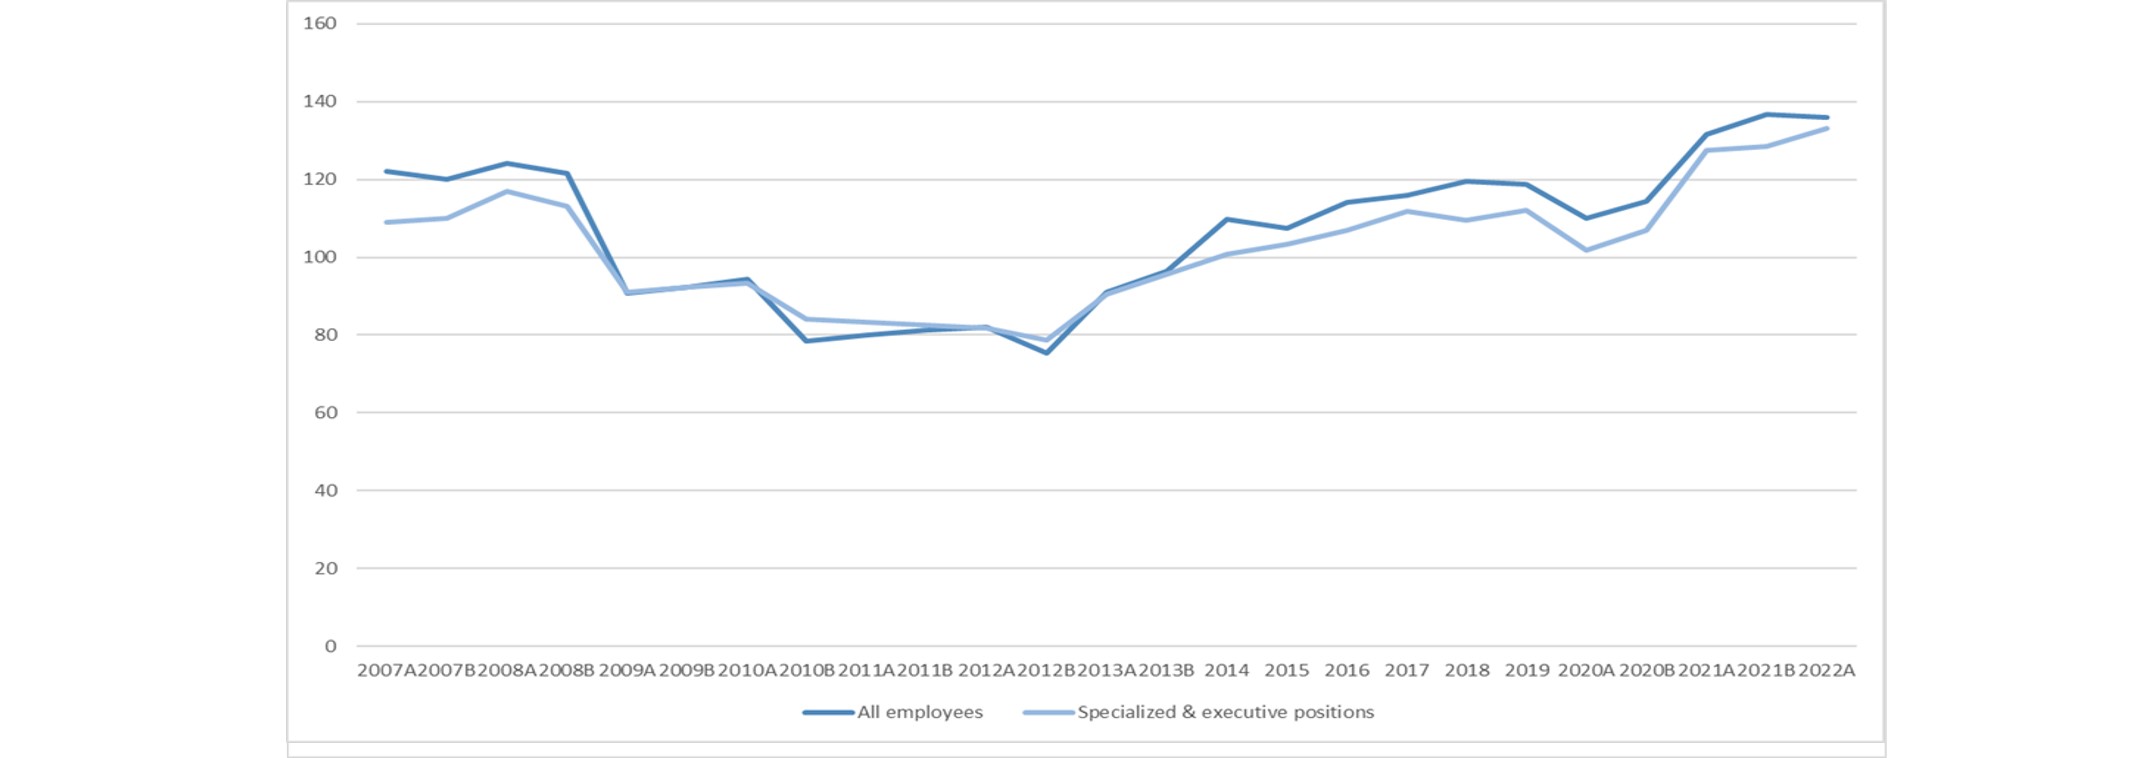
For the first semester of 2024, the general Recruitment Confidence Index increased from 133.0 (in the 2nd semester of 2023) to 136.3 and the specialized Index for managerial and executive positions dropped from 127.9 (in the 2nd semester of 2023) to 125.0.
Sponsors
Special Theme Supporter
2023-B
The Index
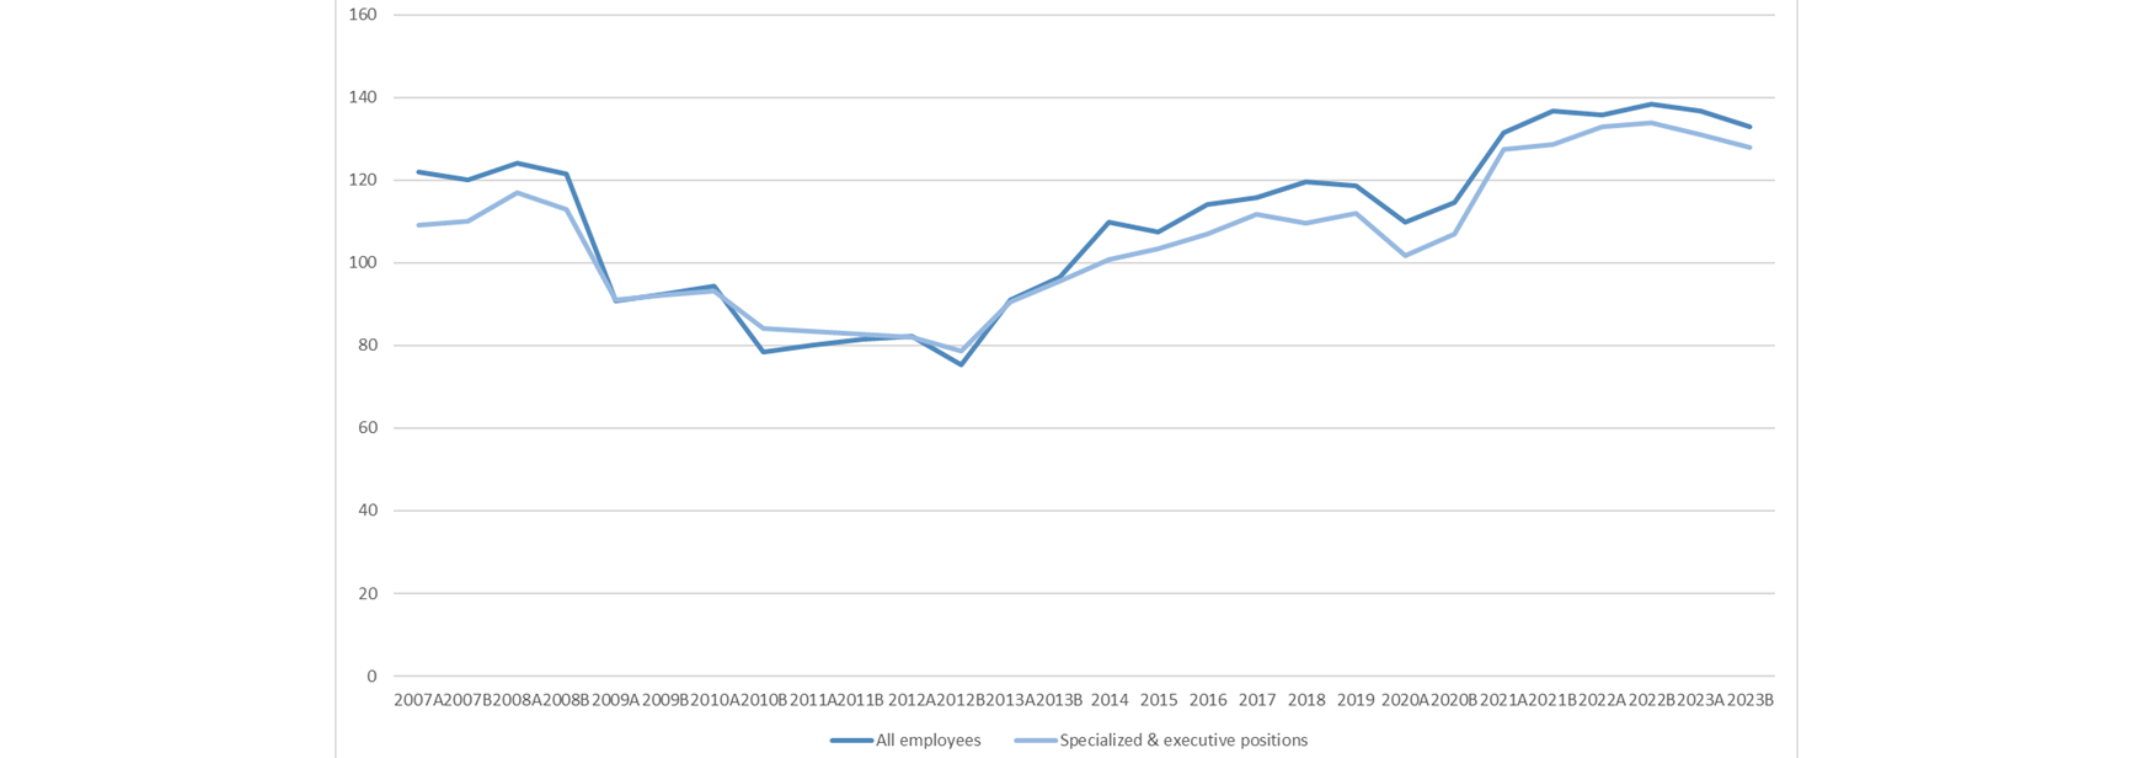
For the second semester of 2023, the general Recruitment Confidence Index decreased from 136.7 (in the 1st semester of 2023) to 133.0 and the specialized Index for managerial and executive positions also dropped from 130.9 (in the 1st semester of 2023) to 127.9.
Sponsors
Special Theme Supporter
2023-A
.png)
The Index
For the first semester of 2023, the general Recruitment Confidence Index decreased from 138.4 (in the 2nd semester of 2022) to 136.7 and the specialized Index for managerial and executive positions also dropped from 133.8 (in the 2nd semester of 2022) to 130.9.
Sponsors
Special Theme Supporter
2022-B
The Index
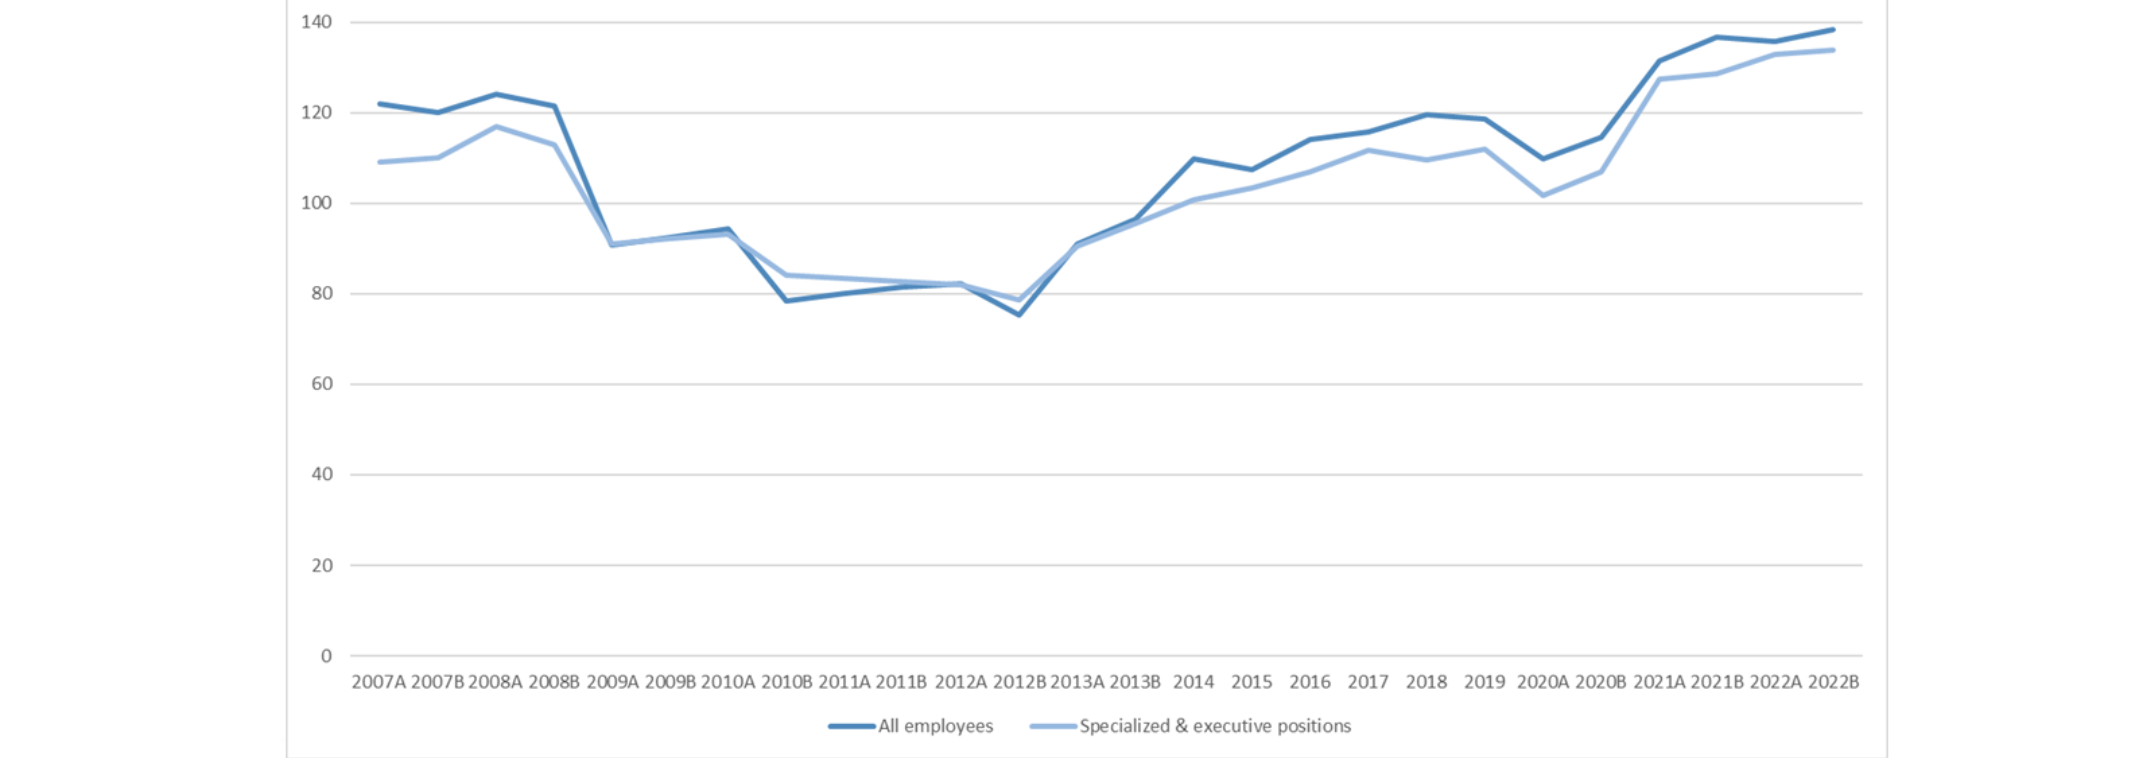
For the second semester of 2022, the general Recruitment Confidence Index increased from 135.8 (in the 1st semester of 2022) to 138.4 and the specialized Index for managerial and executive positions also raised from 133 (in the 1st semester of 2022) to 133.8.
Sponsors
Special Theme Supporter
2022-A
The Index
For the second semester of 2024, the general Recruitment Confidence Index decreased from 136.3 (in the 1st semester of 2024) to 114.8 and the specialized Index for managerial and executive positions also dropped from 125.0 (in the 1st semester of 2024) to 118.8.
Sponsors
Special Theme Supporter
2021-B
The Index
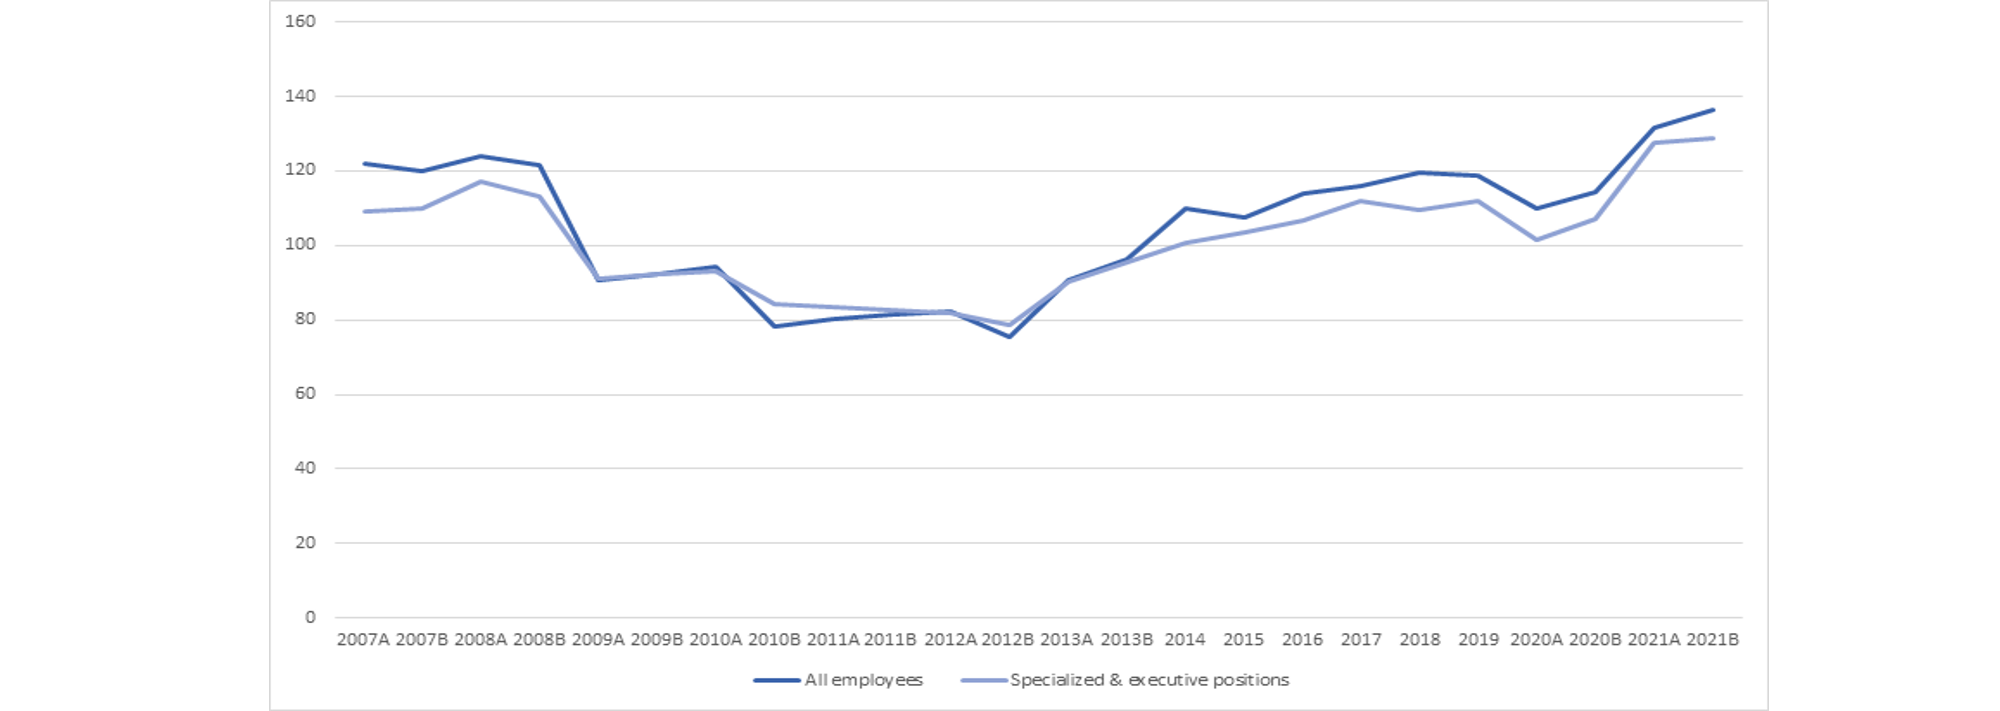
For the second semester of 2021, the general Recruitment Confidence Index raised from 131.6 (in the 1st semester of 2021) to 136.6 and the specialized Index for managerial and executive positions also raised from 127.5 (in the 1st semester of 2021) to 128.6.
Sponsors
Special Theme Supporter
2021-A
The Index
For the first semester of 2021, the general Recruitment Confidence Index raised from 114.5 (in the 2nd semester of 2020) to 131.6 and the specialized Index for managerial and executive positions raised from 107 (in the 2nd semester of 2020) to 127.5.
Sponsors
Special Theme Supporter
2020-B
The Index
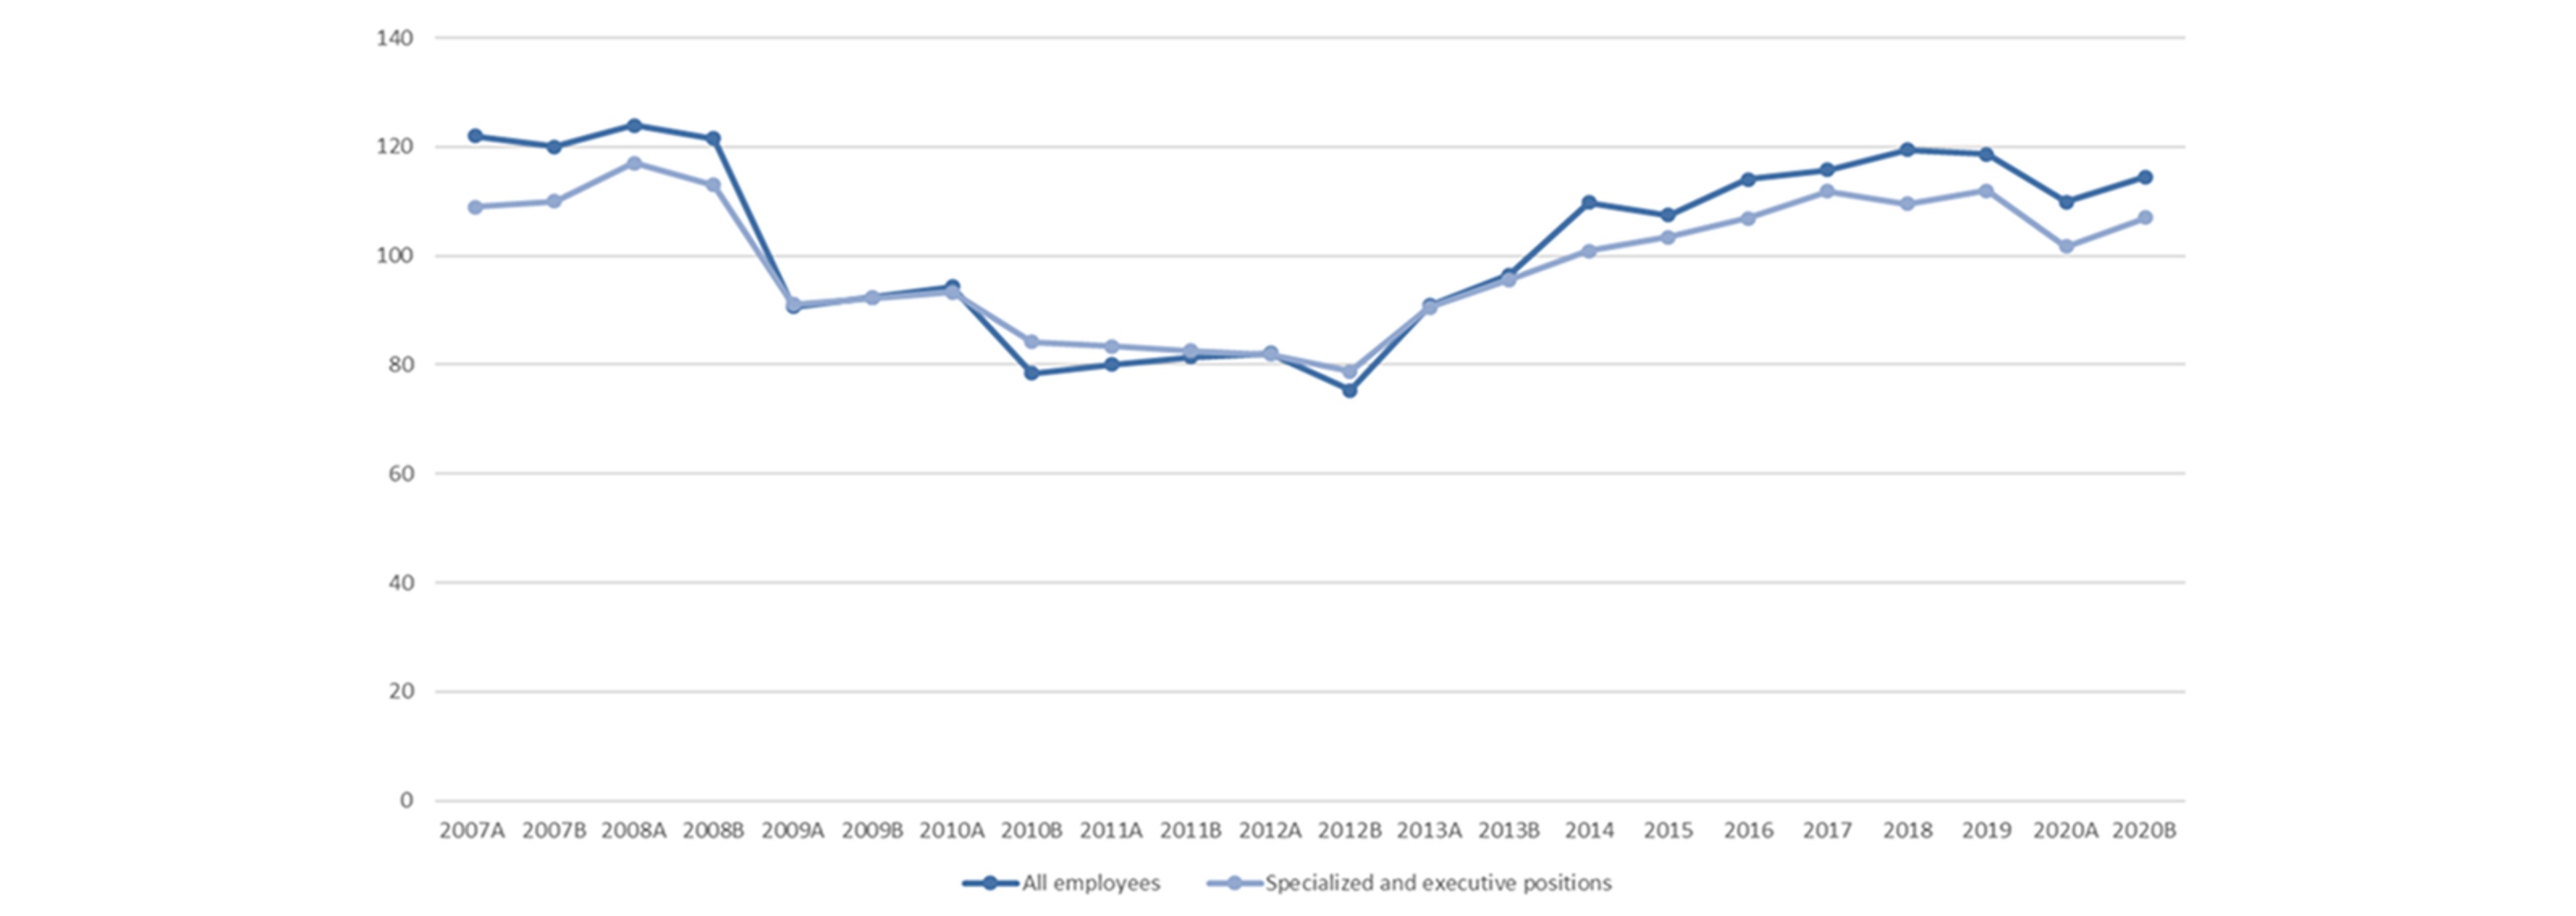
For the second semester of 2020, the general Recruitment Confidence Index raised from 109.9 (in 2020-A) to 114.5 (in 2020-B). The specialized Index for managerial and executive positions also raised from 101.7 (in 2020-A) to 107.0 (in 2020-B).
Sponsors
Special Theme Supporter
2020-A
The Index
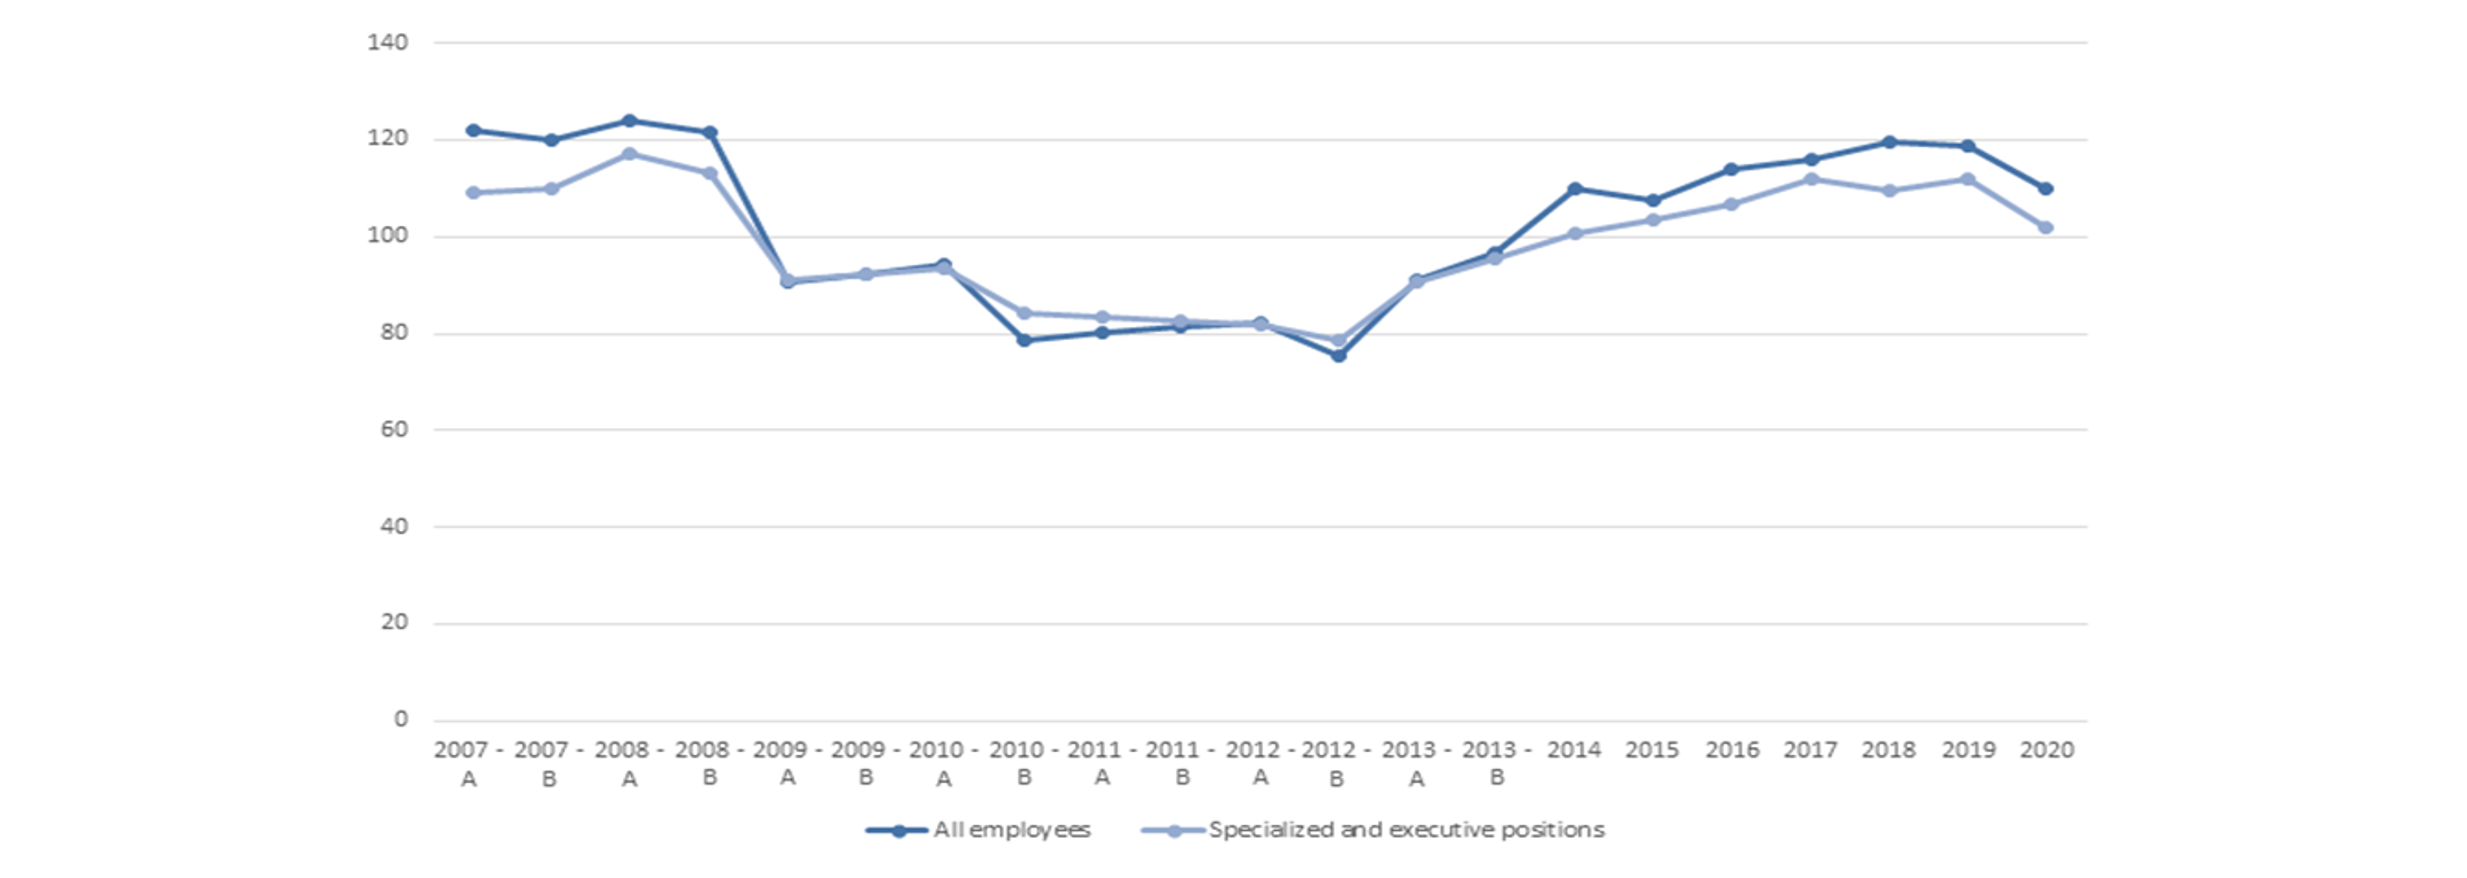
For the first semester of 2020, the general Recruitment Confidence Index dropped from 118.7 (in 2019) to 109.9 (in 2020-A). The specialized Index for managerial and executive positions also dropped from 112 (in 2019) to 101.7 (in 2020-A).
Sponsors
Special Theme Supporter
2019
The Index
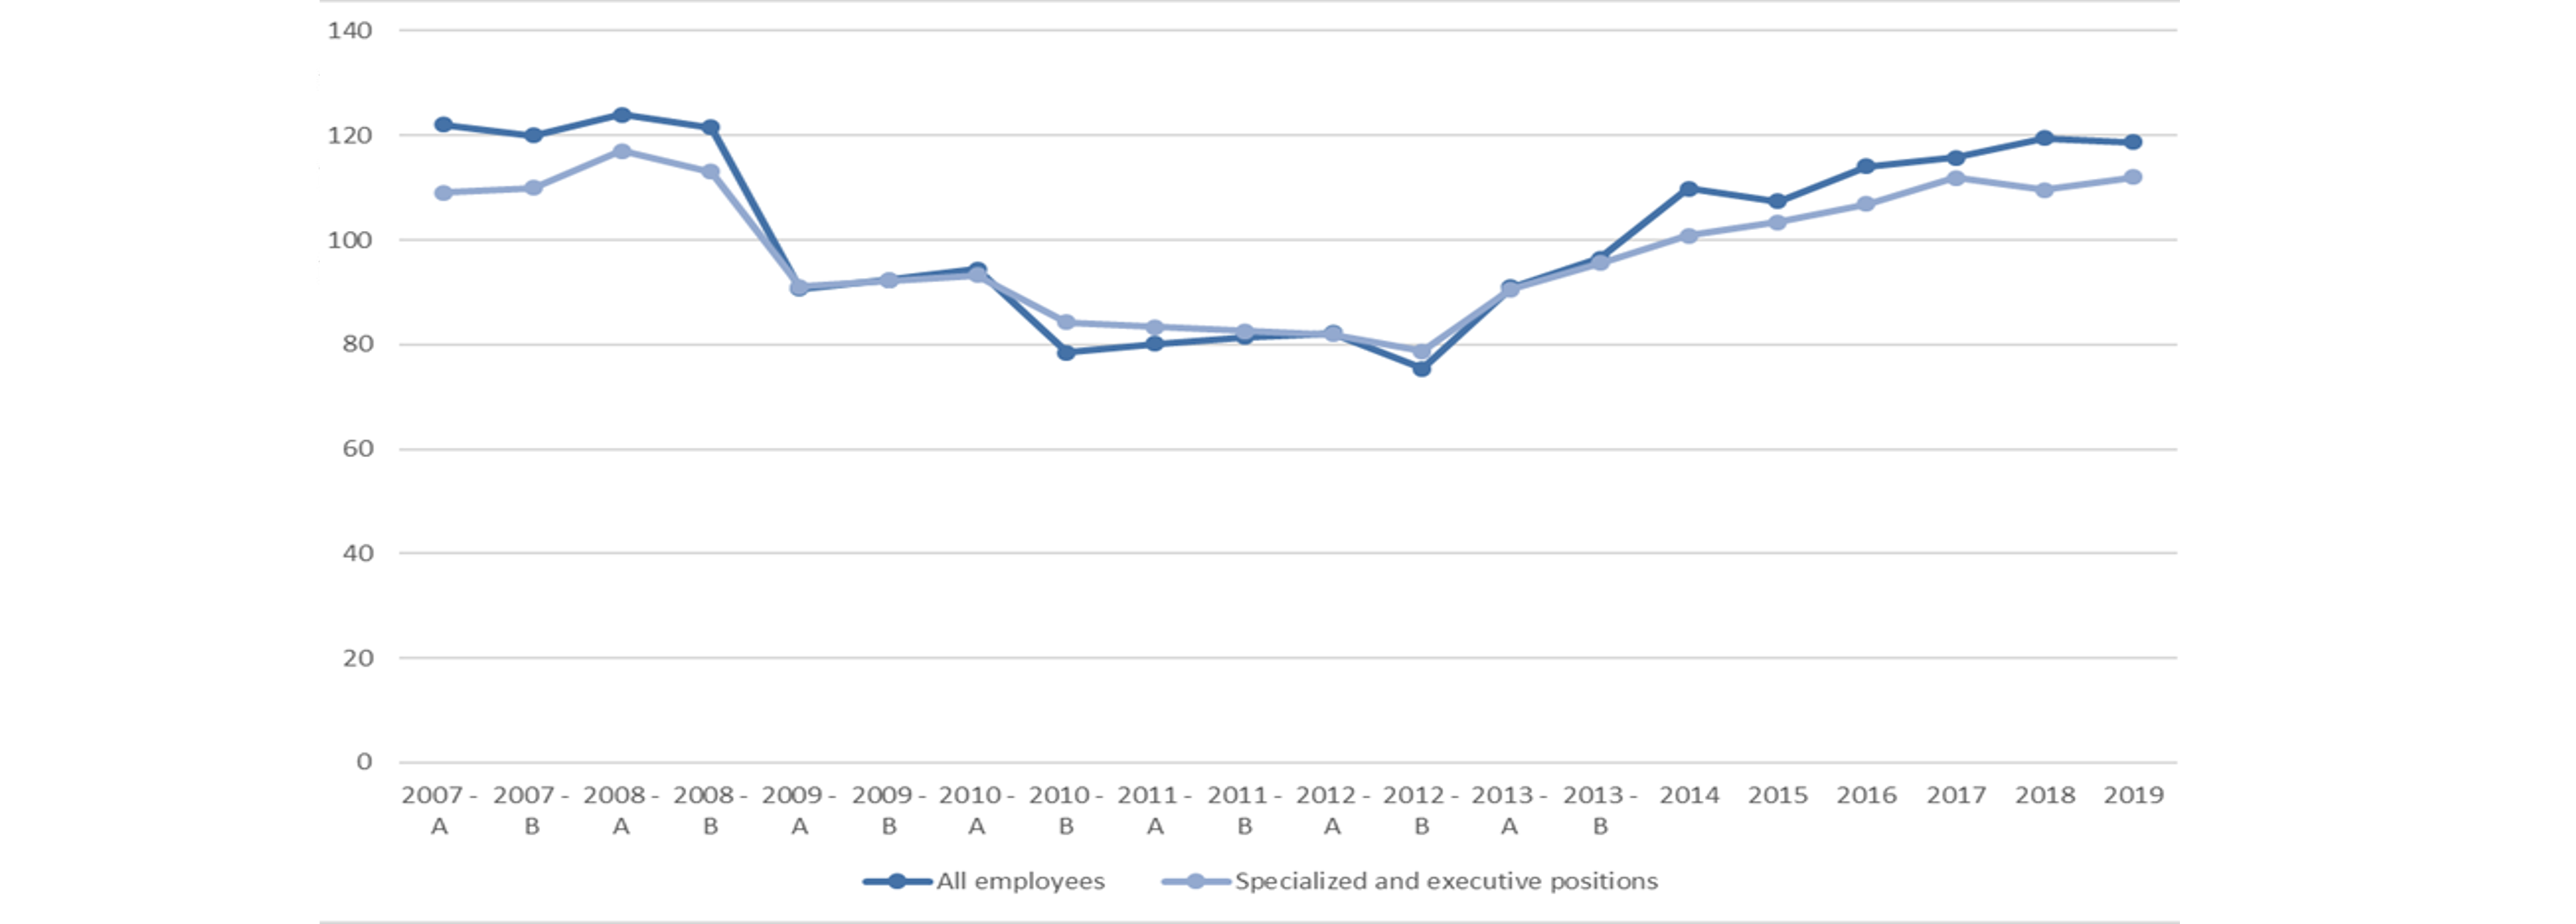
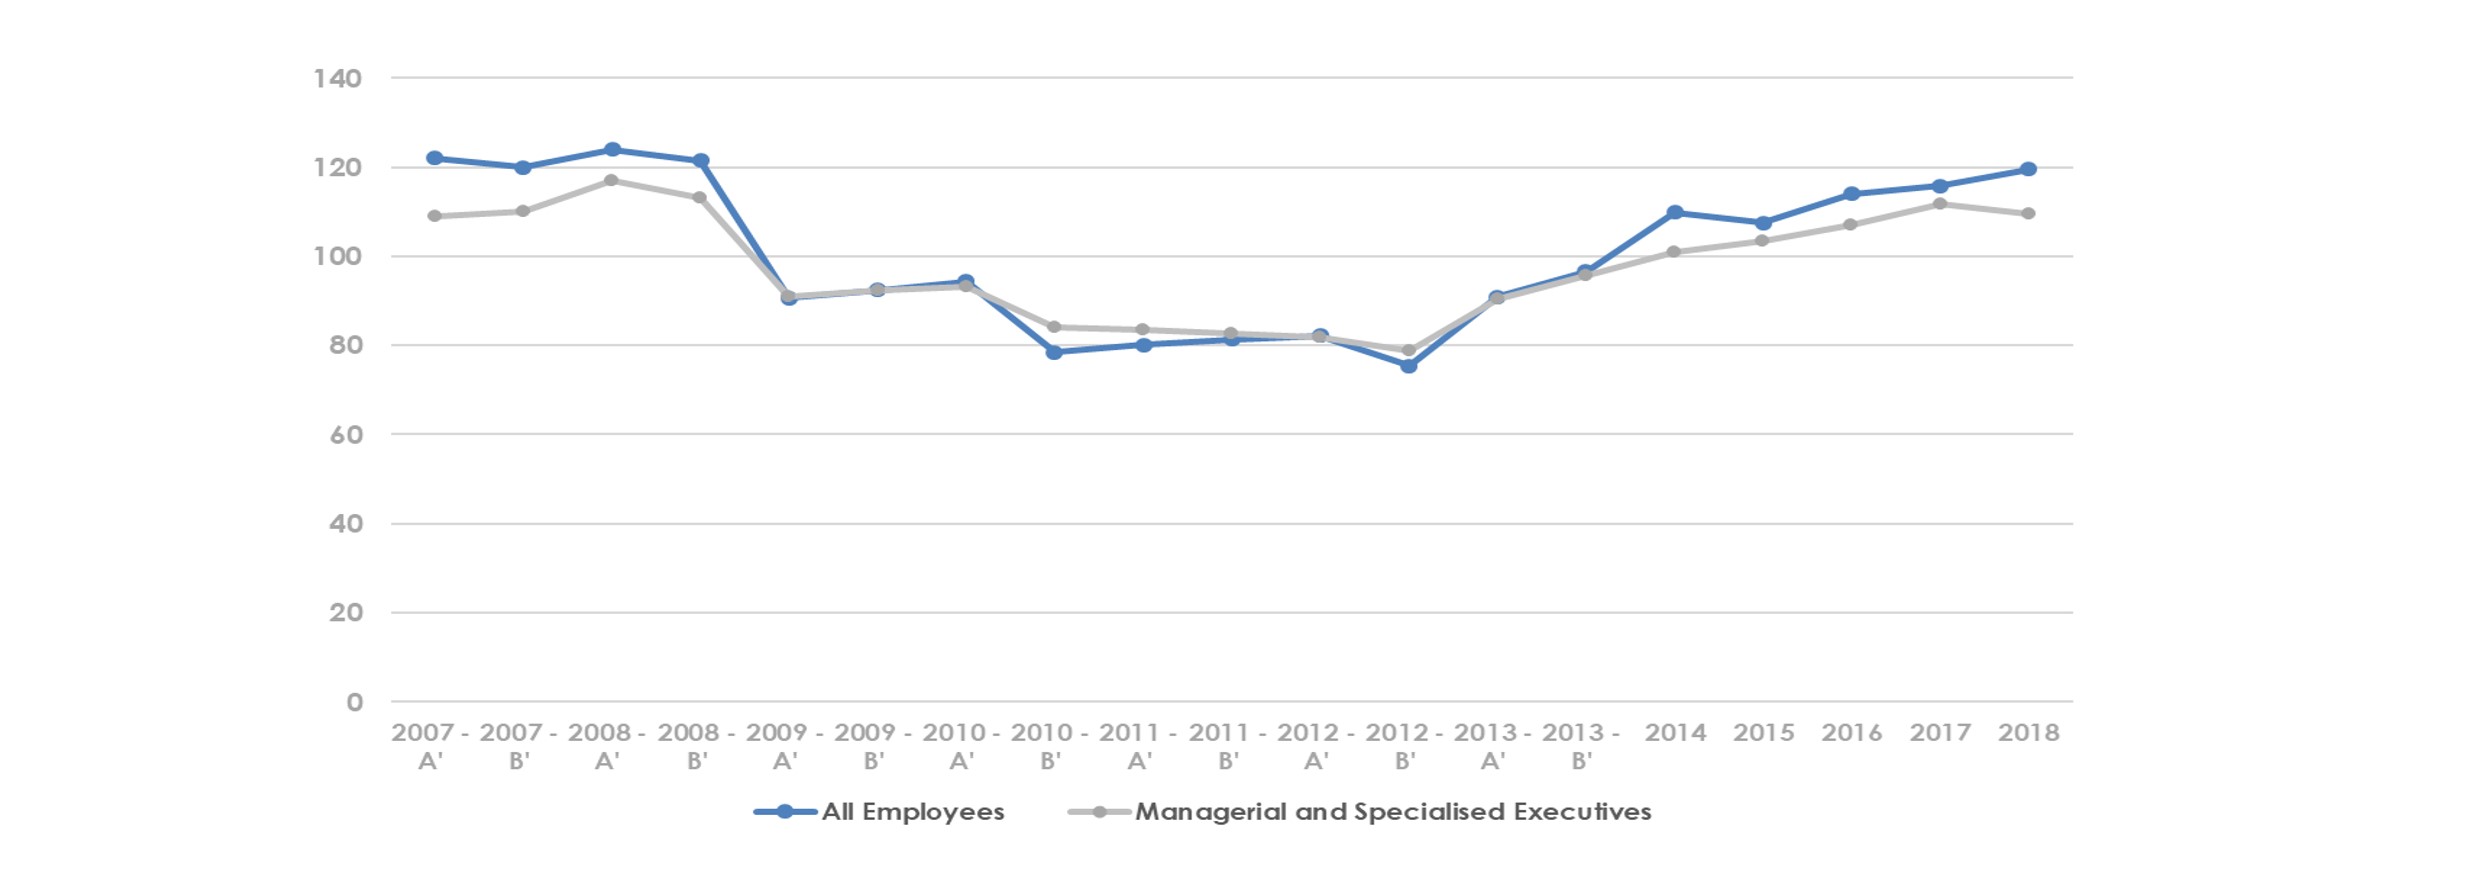
For 2019 the general Recruitment Confidence Index remained relatively stable moving from 119.5 (in 2018) to 118.7 (in 2019). The specialized Index for managerial and executive positions increased from 109.6 (in 2018) to 112 (in 2019).
Sponsors

Special Theme Supporter
2018
The Index
For 2018 the general Recruitment Confidence Index moved up to 119.5 from 115.8 in 2017, while the specialized Index for managerial and executive positions lowered to 109.6 from 111.8 in 2017.
Special Theme Supporter
Best Workplaces Competition
.jpg)